


 31 / 220

2 7
Kumpulan Fima Berhad (11817-V) •
Annual Report 2018
Management discussion and analysis
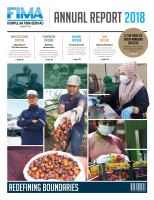
KEY FINANCIAL highlights
REVENUE
FYE2017
RM million
Contribution
%
FYE2018
RM million
Contribution
%
Variance
RM million
Variance
%
Manufacturing
233.35
42.6
140.78
29.2
(92.57)
(39.7)
Plantation
146.87
26.8
153.65
31.8
6.78
4.6
Bulking
47.46
8.7
53.54
11.1
6.08
12.8
Food
114.26
20.9
129.27
26.8
15.01
13.1
Others
5.27
1.0
5.22
1.1
(0.05)
(0.9)
Group Results
547.21
100.0
482.46
100.0
(64.75)
(11.8)
FYE2017
FYE2018
Variance %
Revenue
RM million
547.21
482.46
(11.8)
Cost of Sales (COS)
RM million
339.15
294.07
(13.3)
Gross Profit
RM million
208.07
188.40
(9.5)
Gross Profit Margin
%
38.0
39.1
2.9
Earnings Before Interest And Taxation (“EBIT”)
RM million
85.42
81.98
(4.0)
Profit Before Tax (“PBT”)
RM million
84.67*
80.48
(4.9)
Profit After Tax (“PAT”)
RM million
50.43
48.77
(3.3)
Profit Attributable to Equity Holders of The Company
RM million
29.84
32.06
7.4
Return on Average Shareholders’ Equity (“ROAE”)
%
5.0
4.8
(3.2)
Return on Average Capital Employed (“ROACE”)
%
8.0
7.7
(3.5)
Total Returns to Shareholders
- Gross Dividend Per Share
sen
9.00
9.00**
-
Net Cash Flow Generated From/(Used in) Operation
RM million
191.11
(7.52)
(103.9)
Total Assets
RM million
1,224.28
1,168.21
(4.6)
Total Liabilities
RM million
197.87
170.61
(13.8)
Capital Employed
RM million
1,077.34
1,052.14
(2.3)
Retained Earnings
RM million
315.38
322.33
2.2
* Without the impairment losses of RM29.37 million related to the property, plant and equipment and biological assets, the Group’s PBT would be RM114.04 million.
** Subject to shareholders’ approval.
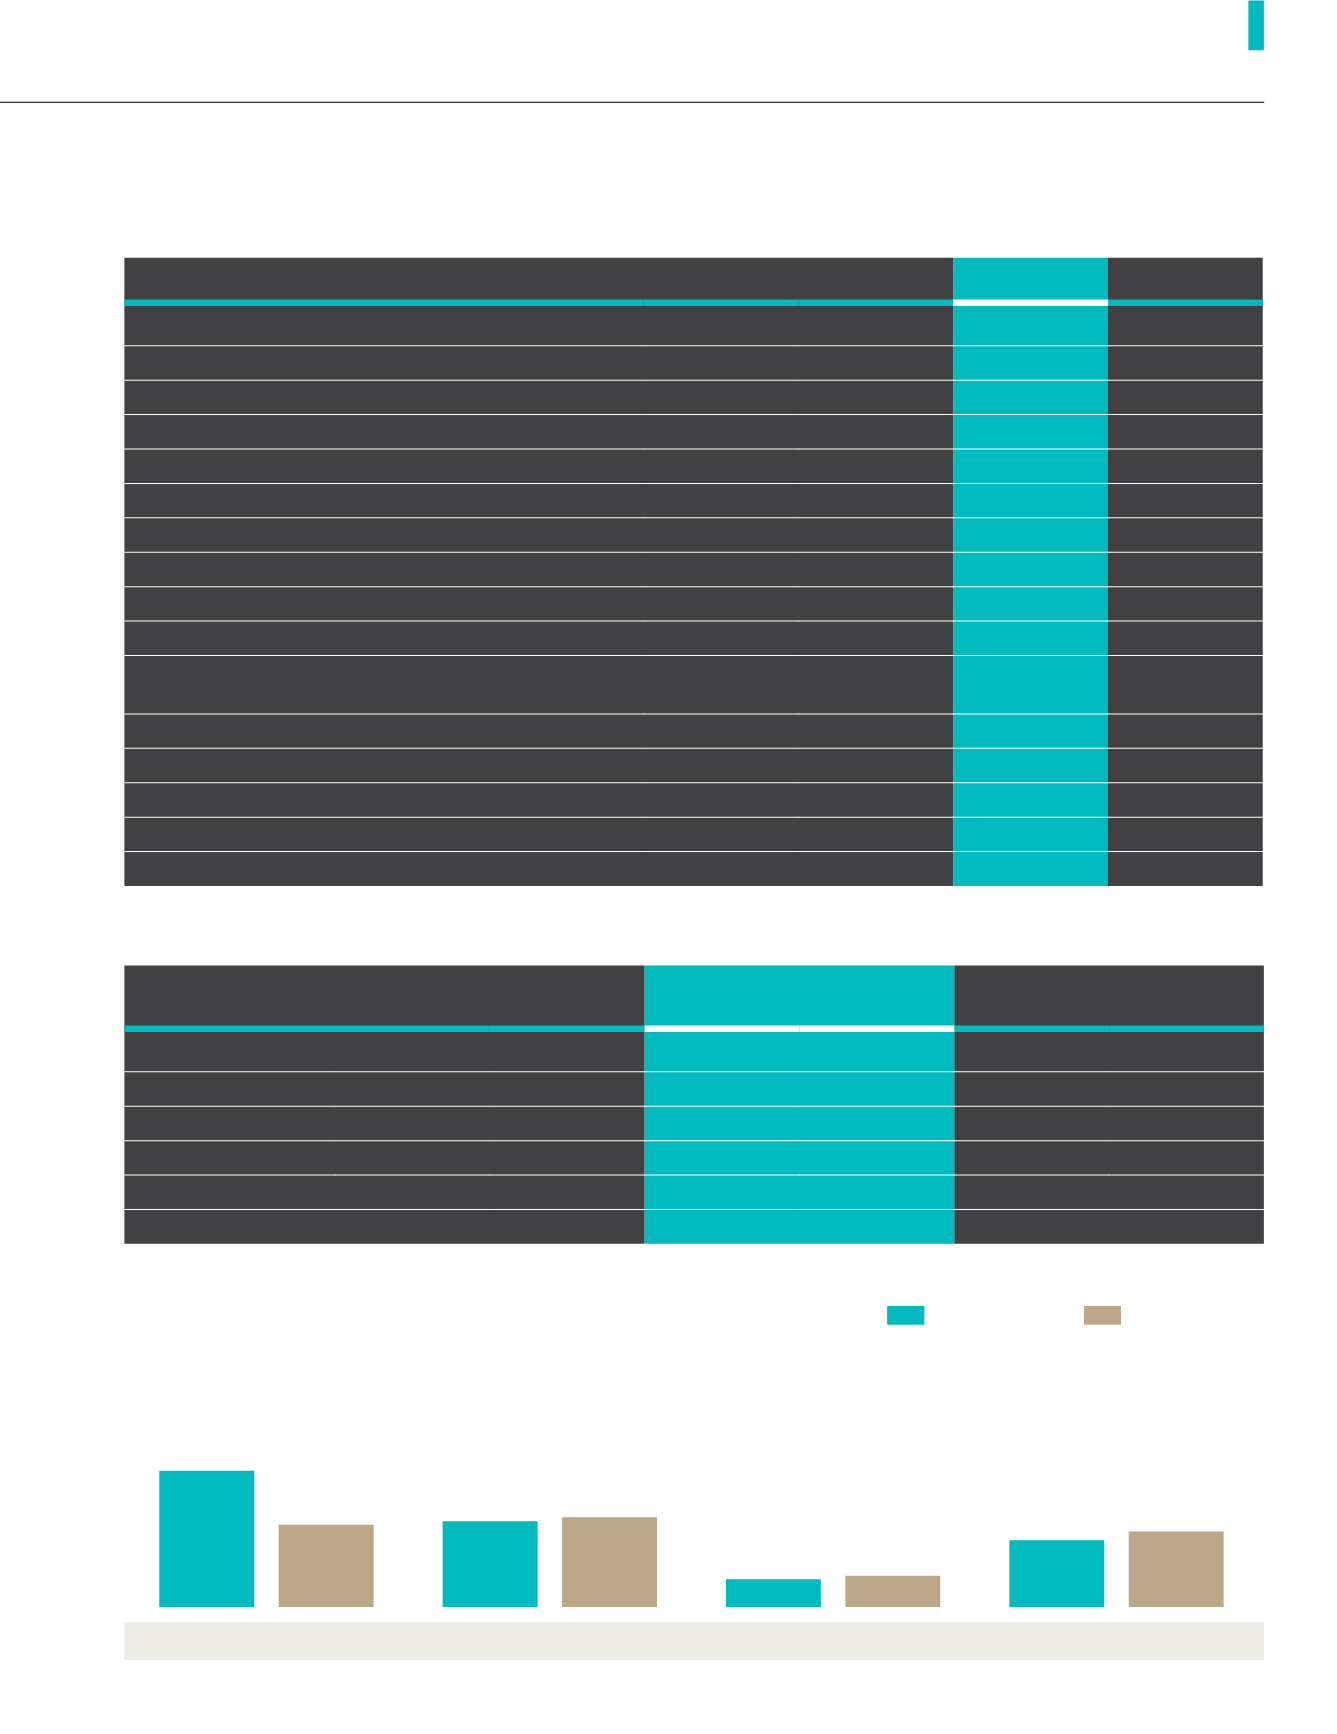
Revenue
BY DIVISION (RM ’million)
233.35
Manufacturing
140.78
146.87
Plantation
153.65
47.46
Bulking
53.54
114.26
Food
129.27
▼
39.7%
-92.57
▲
4.6%
+6.78
▲
12.8%
+6.08
▲
13.1%
+15.01
FYE2017
FYE2018