


 30 / 220

2 6
Performance Review
Management discussion and analysis
KEY FINANCIAL ANALYSIS
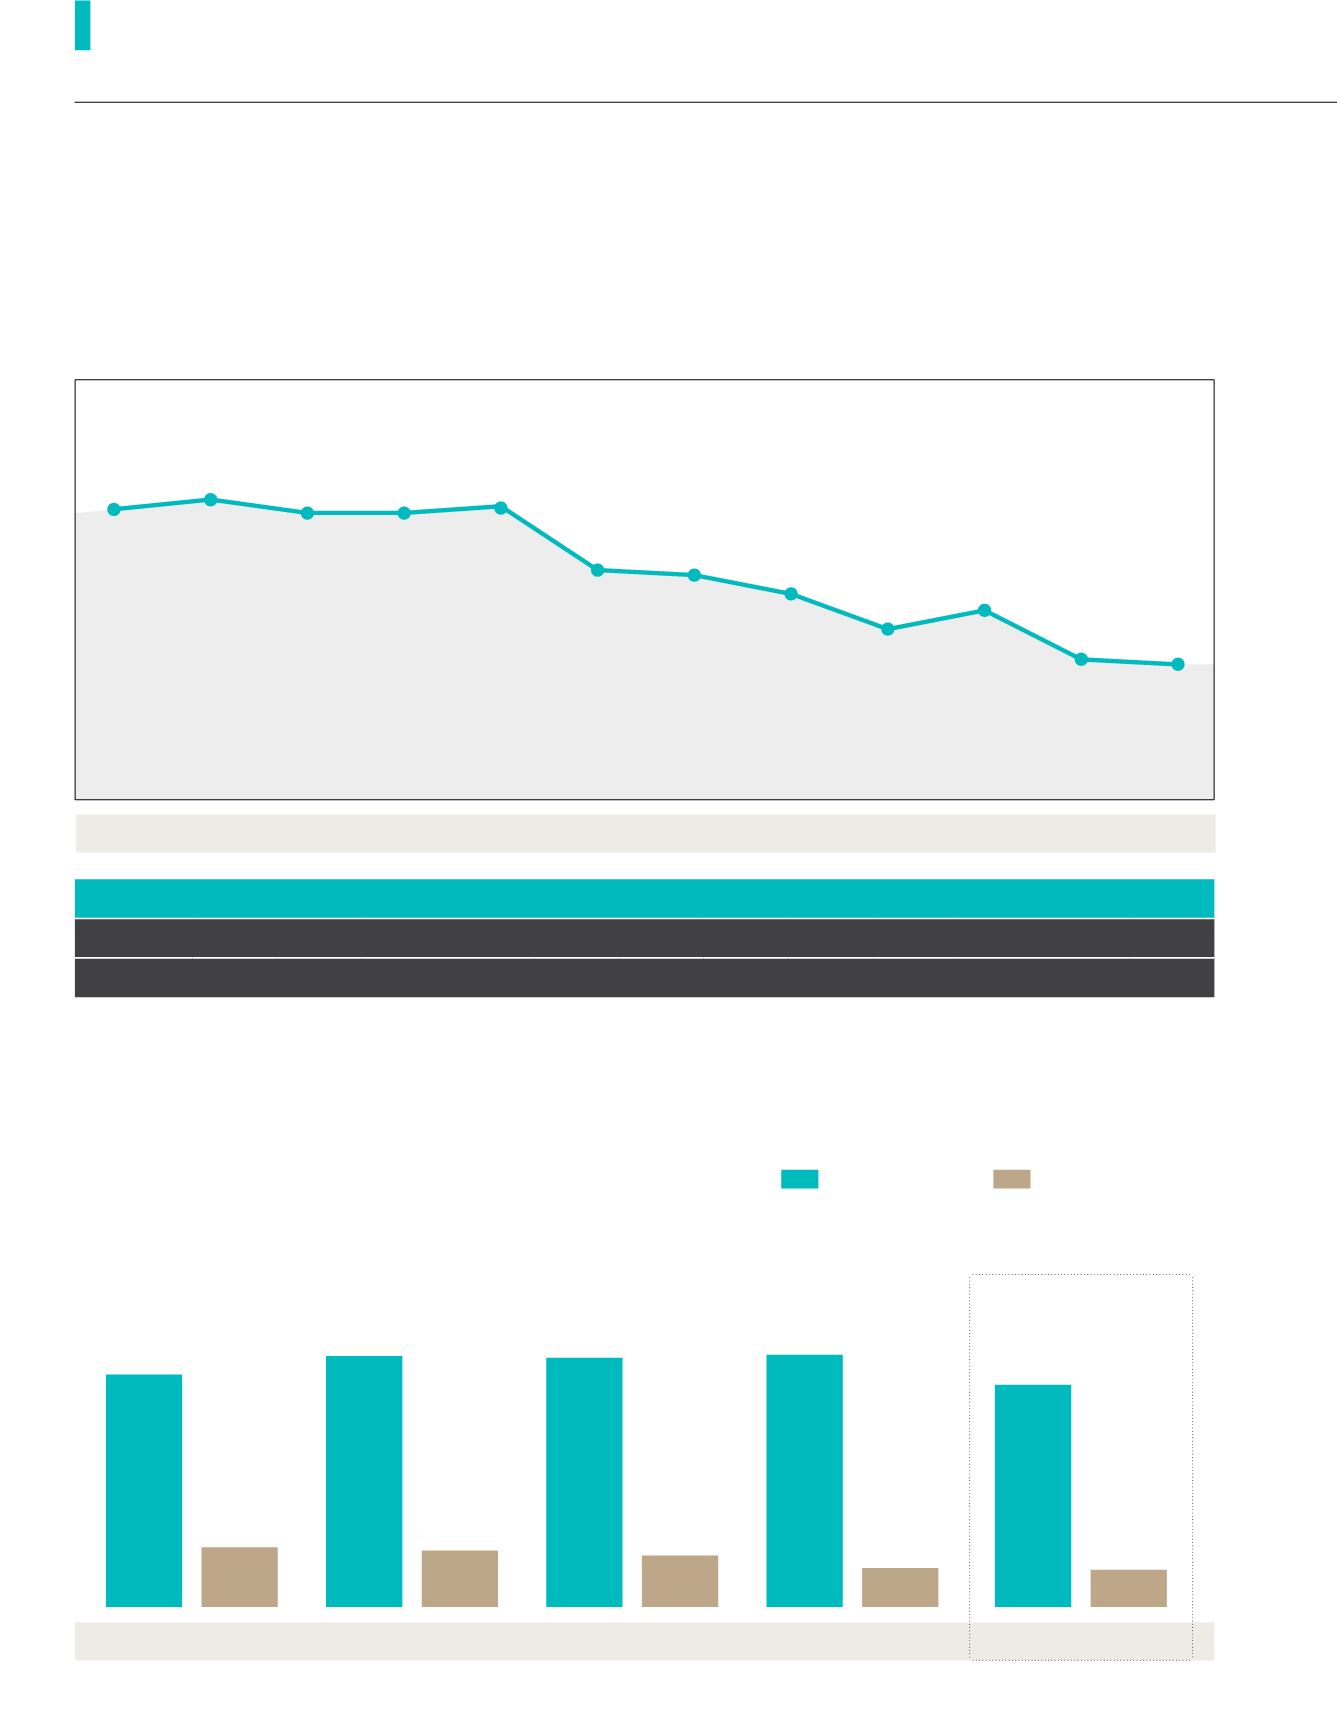
MONTH APR’17 MAY’17 JUN’17 JUL’17 AUG’17 SEP’17 OCT’17 NOV’17 DEC’17 JAN’18 FEB’18 MAR’18
HIGH
1.95 1.96 1.88 1.90 1.90 1.82 1.71 1.70 1.66 1.65 1.60 1.55
LOW
1.82 1.80 1.81 1.82 1.79 1.65 1.68 1.60 1.56 1.57 1.45 1.46
During the year under review, the highest and lowest share price transacted was RM1.96 and RM1.45, respectively. The highest
share volume transacted was in May 2017 with total volume of 5.7 million shares.
504.59
FYE2014
129.36
544.79
FYE2015
122.30
547.21
FYE2017
84.67
541.11
FYE2016
111.67
5-Year Revenue and PBT Performance
(RM ’million)
Revenue
Profit Before Tax
482.46
FYE2018
80.48
1.86
1.70
1.85
1.62
1.88
1.66
1.86
1.51
1.71
1.50
1.85
1.58
Apr’17
oct’17
jul’17
jan’18
may’17
nov’17
aug’17
feb’18
sep’17
mar’18
jun’17
dec’17
One Year Average Monthly Closing Share Price
(RM)