


 37 / 232

Month Apr-18 May-18 Jun-18 Jul-18 Aug-18 Sep-18 Oct-18 Nov-18 Dec-18 Jan-19 Feb-19 Mar-19
High
1.50
1.55
1.59
1.76
1.74
1.73
1.60
1.57
1.60
1.62
1.66
1.68
Low
1.44
1.47
1.50
1.52
1.64
1.50
1.47
1.41
1.48
1.51
1.55
1.63
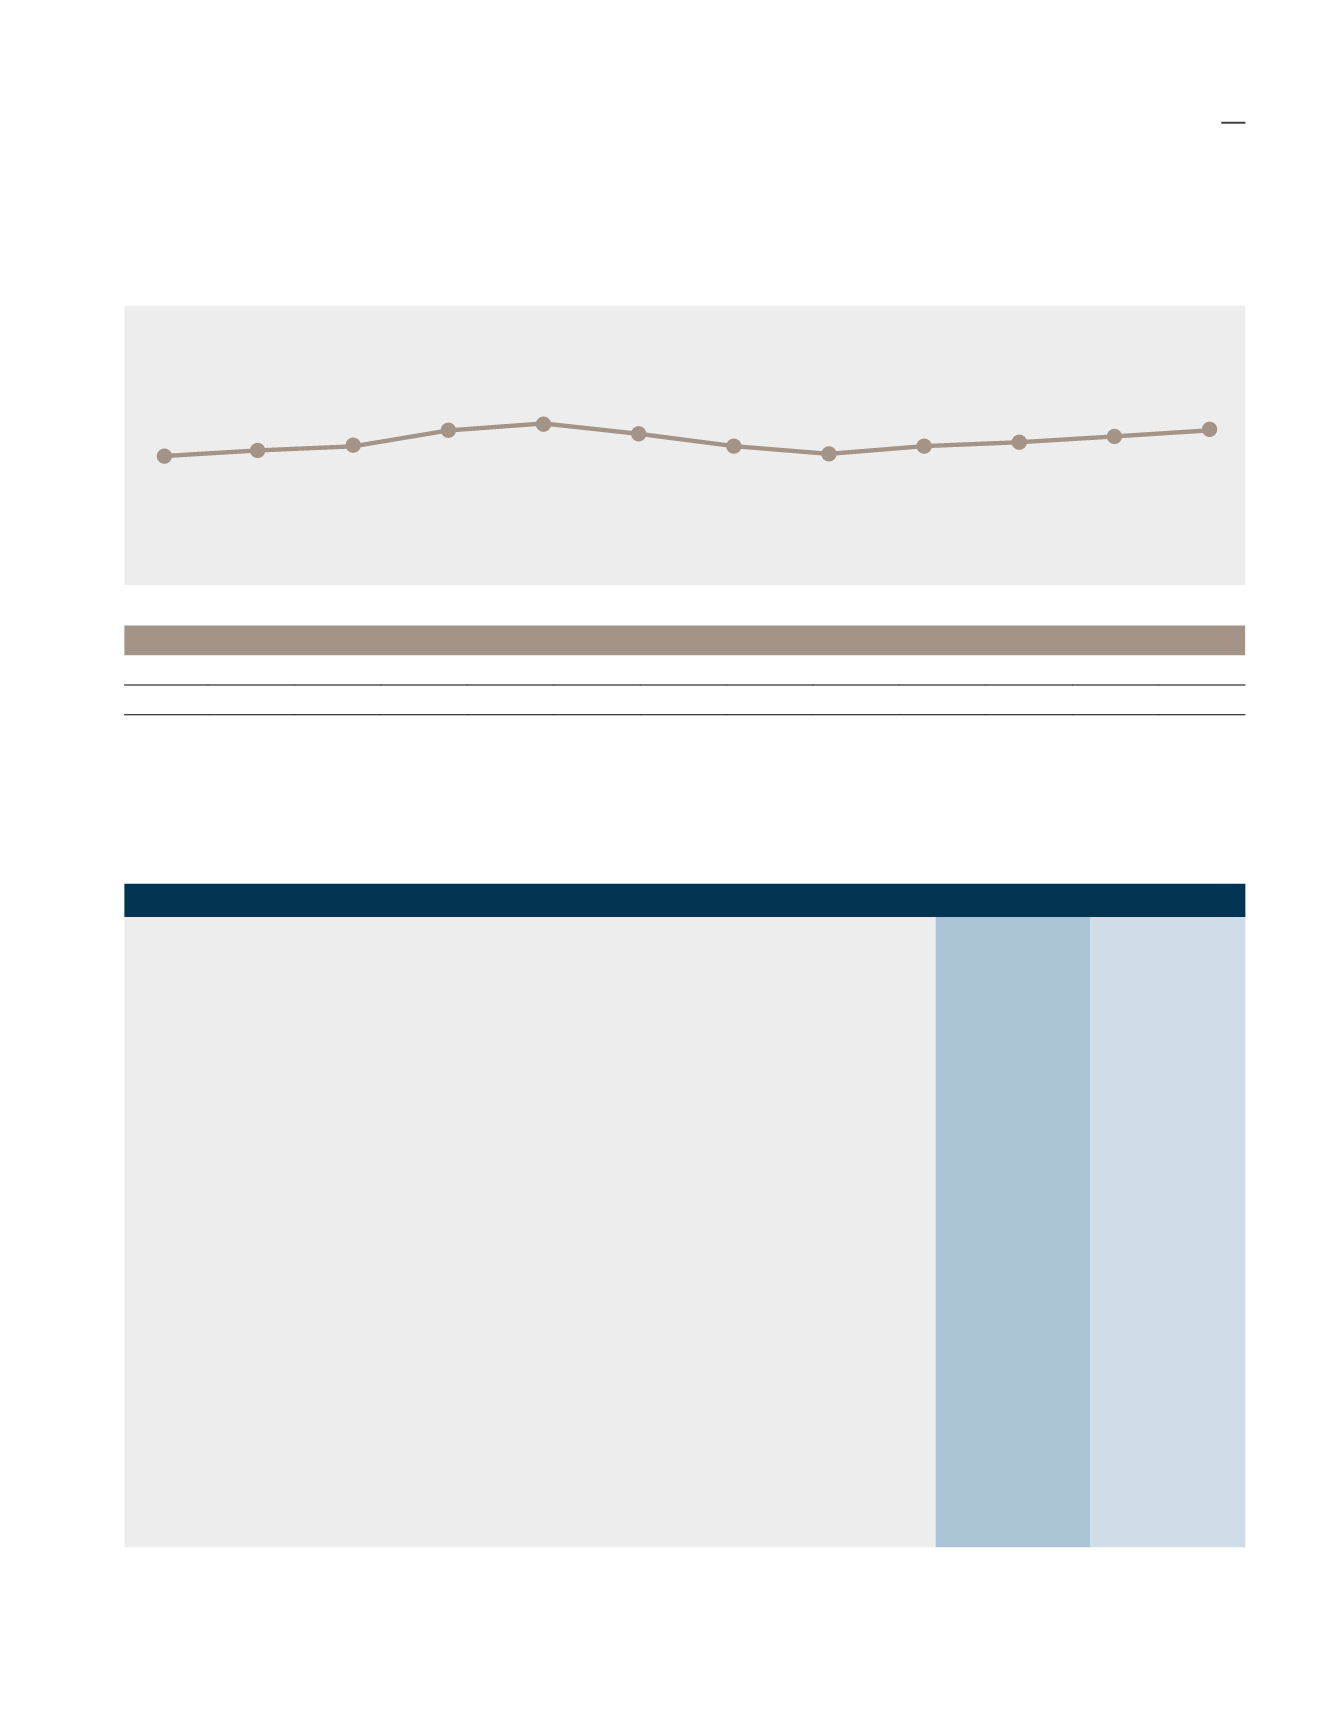
During the year under review, the highest and lowest monthly share price transacted was RM1.76 and RM1.41
respectively.
Key Financial Highlights
FYE2018
FYE2019 Change %
Revenue
RM Million
482.46
469.47
(2.7)
Cost of Sales (“COS”)
RM Million
294.87
278.85
(5.4)
Gross Profit
RM Million
187.59
190.62
1.6
Gross Profit Margin
%
38.9
40.6
1.7
Earnings Before Interest and Taxation (“EBIT”)
RM Million
79.64
116.81
46.7
Profit Before Tax (“PBT”)
RM Million
78.14
114.89
47.0
Profit After Tax (“PAT”)
RM Million
46.64
85.21
82.7
Profit Attributable to Equity Holders of the
Company
RM Million
29.87
59.84
100.3
Return on Shareholders’ Equity (“ROE”)
%
4.7
8.1
3.4
Return on Capital Employed (“ROCE”)
%
7.5
10.5
2.9
Returns to Shareholders
- Gross Dividend Per Share
sen
9.00
*9.00
-
Net Cash Flow (Used in)/Generated from
Operating Activities
RM Million
(7.52)
52.78
801.9
Total Asset
RM Million
1,171.76
1,233.90
5.3
Total Liabilities
RM Million
171.84
176.94
3.0
Capital Employed
RM Million
1,055.69
1,115.69
5.7
Retained Earnings
RM Million
398.99
433.56
8.7
* Subject to shareholders’ approval.
One Year Average Monthly Closing Share Price
(RM)
Apr’18
oct’18
jul’18
jan’19
may’18
nov’18
aug’18
feb’19
sep’18
mar’19
jun’18
dec’18
1.47
1.51
1.55
1.64
1.69
1.62
1.54
1.49
1.54
1.57
1.61
1.66
Key Financial Analysis
performance
review
33