


 48 / 80

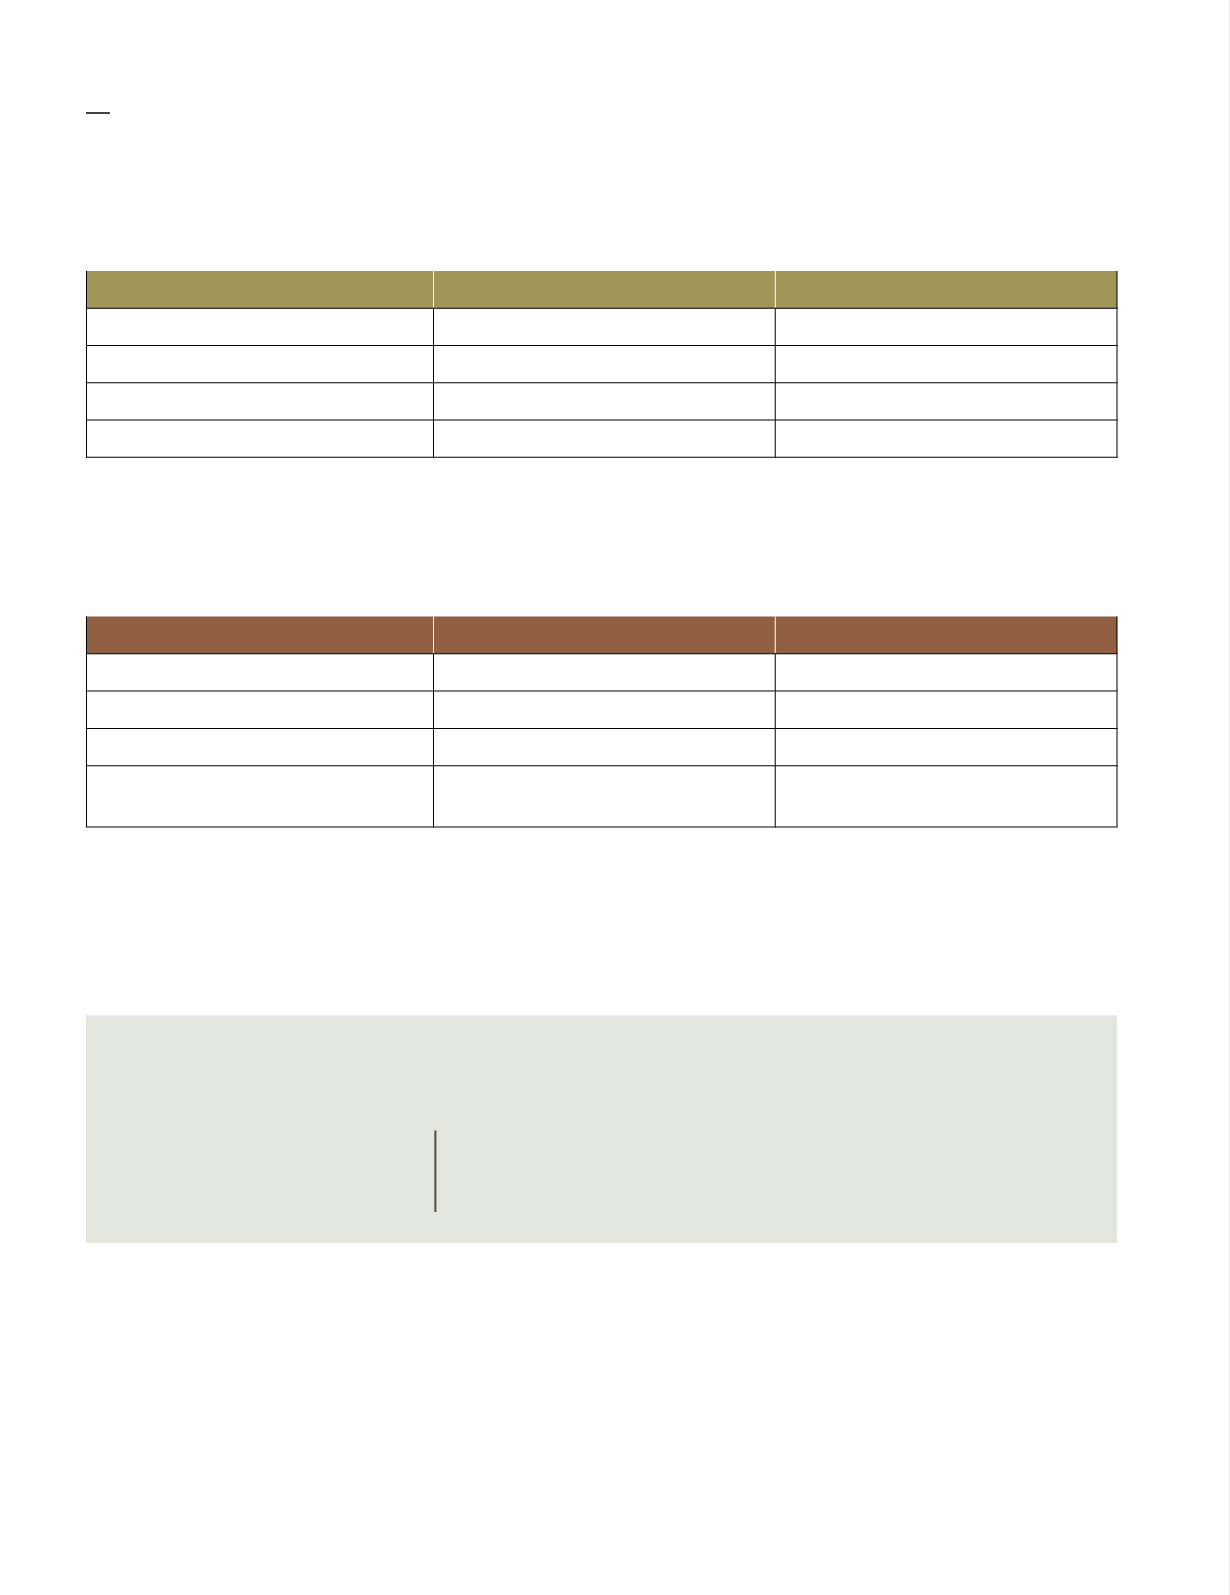
Bulking
Our greenhouse gas emissions
FYE2018
FYE2019
Scope 1 – Direct emission
5,819.75 tCO
2
eq/litre
6,779.99 tCO
2
eq/litre
Scope 2 – Indirect emission
1,050.01 tCO
2
eq/kWh
1,482.43 tCO
2
eq/kWh
Total emissions
6,869.76 tCO
2
eq
8,262.42 tCO
2
eq
Emission intensity by Product Storage 0.0072 tCO
2
eq per MT product storage 0.0081 tCO
2
eq per MT product storage
Bulking Division
recorded a 16.5% increase in total emissions on the back of increased operational activity and
record level throughput achieved during the year under review. The division will strive to look for opportunities to
reduce its carbon emissions moving forward.
Food
Our greenhouse gas emissions
FYE2018*
FYE2019
Scope 1 – Direct emission
3,277.26 tCO
2
eq/litre
3,628.56 tCO
2
eq/litre
Scope 2 – Indirect emission
2,778.83 tCO
2
eq/kWh
2,786.57 tCO
2
eq/kWh
Total emissions
6,056.79 tCO
2
eq
6,415.13 tCO
2
eq
Emission intensity by Fished
Processed
0.6748 tCO
2
eq per MT fish
processed
0.7050 tCO
2
eq per MT fish
processed
* restated
IFC saw a 10% increase in direct emissions compared to the previous year as a result of increased economic
activity.
Note: Scope 1 – CO
2
emissions through a diesel engine, transportation, fertilizer, POME and physical operation
Scope 2 – Purchase of electricity from TNB, SESB, SESCO, PNG power, etc.
Total Group Internally Generated Energy
Solar Power
34,950.75
kWh
Co-generation Plant (Biomass)
6,216,230
kWh
46
Kumpulan Fima Berhad
(11817-V)
SUSTAINABILITY Report 2019