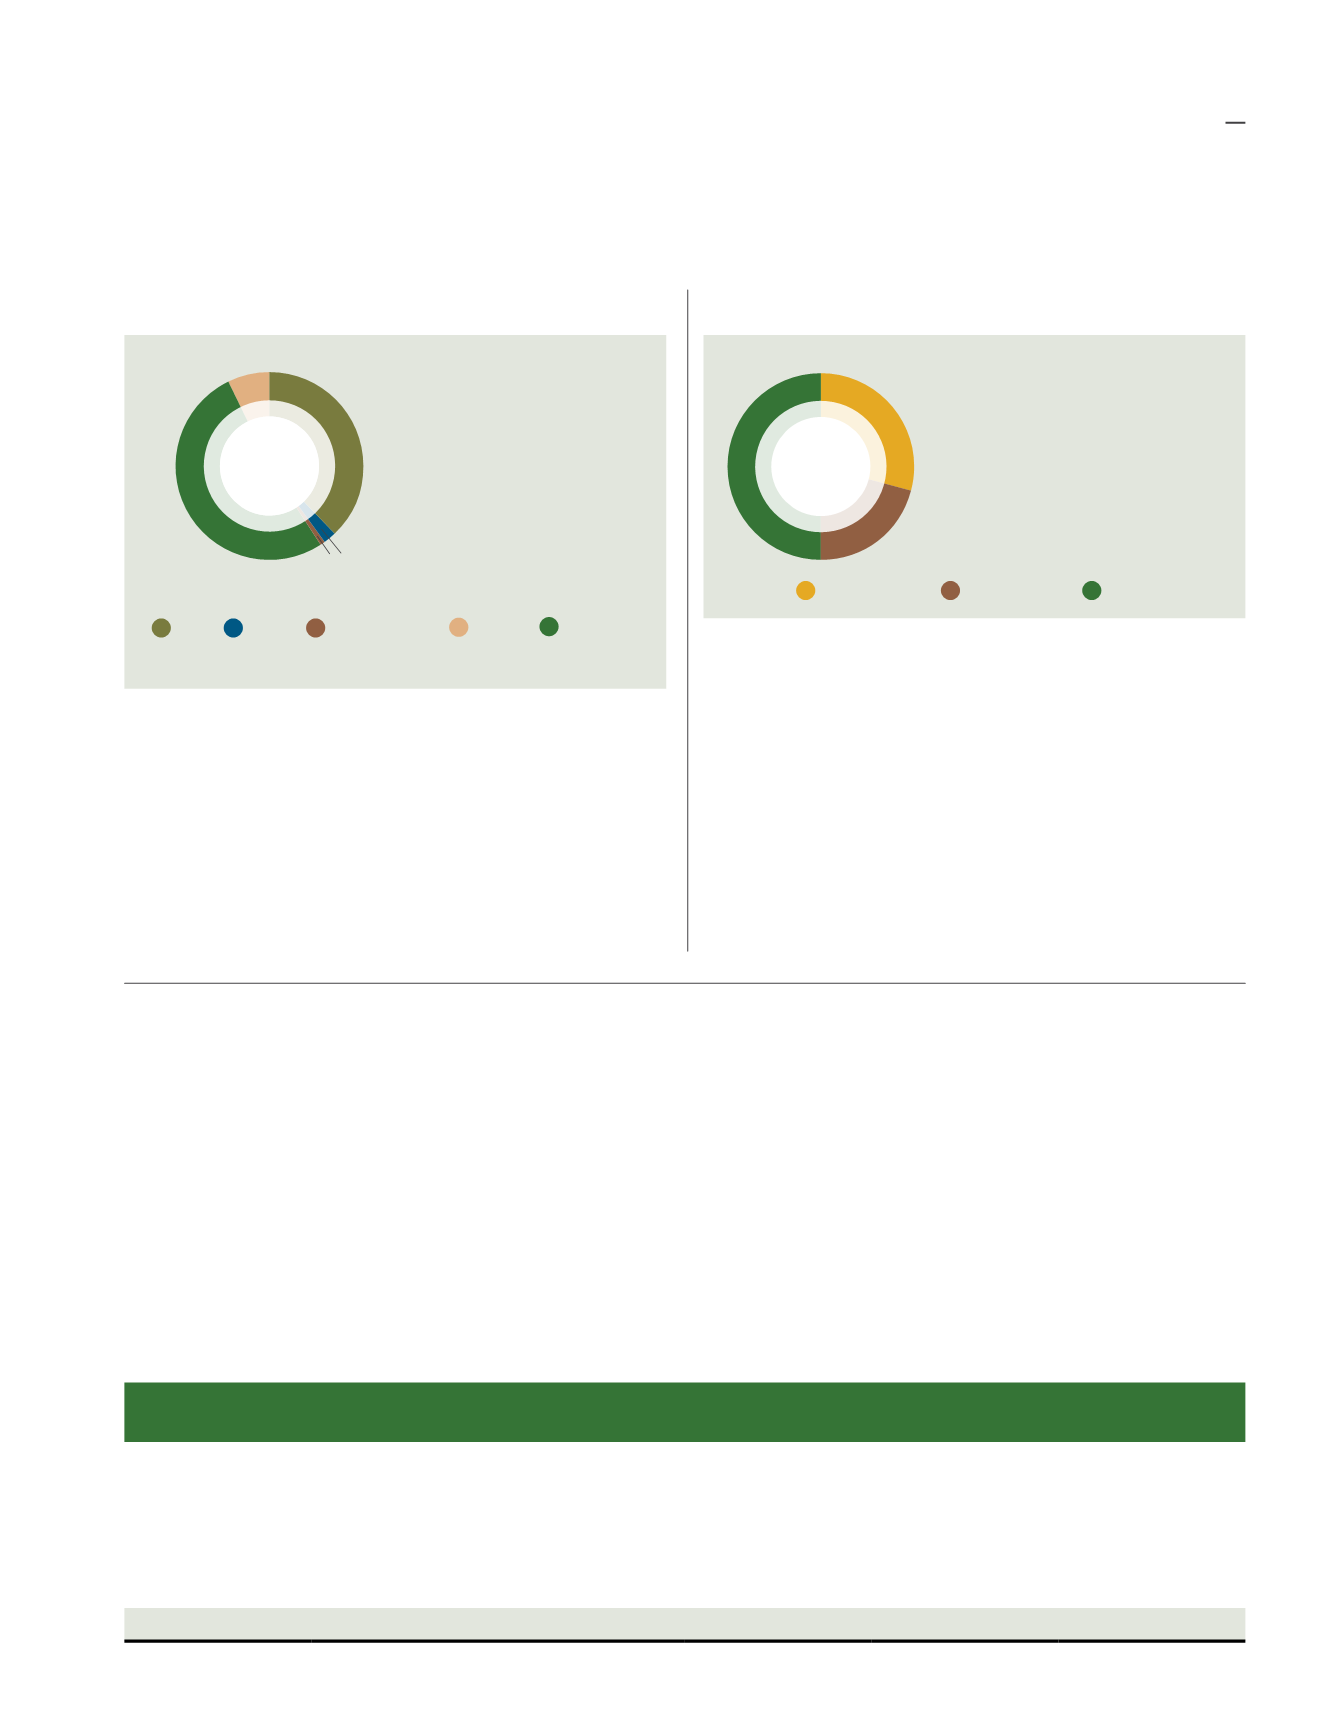

Breakdown of Water Usage by Mill (m
3
)
Boiler
Processing
Domestic*
384,222.00
m
3
of water consumption by mill in FYE2019
(FYE2018: 394,510.00 m
3
)
Domestic*: This includes usage from the rest house, canteen,
mill (non-operational), main office and worker’s quarters
During the year, water consumption of PTNJL’s palm
oil mill has decreased by 2.6% in total compared to last
year, largely as a result of the decrease in domestic
usage (6.1%).
PTNJL has also set aside areas within its plantation
as water catchment zone. Chemical applications
are strictly prohibited at the water catchment zone
to facilitate natural re-vegetation of the area and
preservation thereof.
Energy Management
D
ifferent businesses have quite different energy use profiles and scale. For example,
Manufacturing
operations
source much of their energy from electricity whereas
Food Division
relies heavily on diesel consumption.
Recognising that one size does not fit all, the Group’s Engineering team has been and continues to identify,
test and refine methods and look for opportunities, however small the scale, to reduce the Group’s energy usage.
For instance, replacement of less efficient lightings and HVAC maintenance and optimisation completed during
FYE2019 for the Group’s headquarters in Kuala Lumpur will reap an estimated energy savings of 236,400 kWh per
year. This is equivalent to the average annual electricity used by 29 households*. There are plans to expand the use
of solar energy at the Group’s oil palm plantations in this current financial year.
* Source: US EPA calculator
Improving our energy efficiency not only reduces the use of natural resources and emissions of CO₂ and other
pollutants but also potentially lowers costs.
Division
Diesel
(L)
Petrol
(L)
Fuel Oil
(L)
Grid Electricity
(kWh)
Solar
(kWh)
Bulking
280,401.47
6,006.52 2,046,386.00 1,684,584.09
-
Food
1,353,273.93
6,680.00
-
3,164,951.31
-
Manufacturing
6,513.39
1,100.54
-
2,731,166.45
-
Plantation
2,124,311.04
92,716.53
-
171,053.41
-
Head Office
-
20,446.88
-
1,532,768.59
34,951.75
Grand Total
3,764,498.83
126,946.46 2,046,386.00 9,284,522.86
34,951.75
Water Consumption
Breakdown of Water Consumption by Division (m
3
)
839,941.76
m
3
Total water consumed by the Group
(FYE2018: 734,432.00 m
3
)
Plantation
Bulking
Head
Office
Building
Food
Manufacturing
The increase in water consumption in IFC was a result of
a couple of factors, the first of which is due to an increase
in IFC’s total fish production by 28%, on the back of
improved demand for mackerel in the PNG market. This, in
turn, led to IFC procuring more mackerel from its suppliers
and this includes purchasing frozen-on-deck mackerel.
These frozen-on-deck mackerel requires thawing which
involves higher water usage. We recognize the need for
reducing our water consumption and will strive to do so
through greater efficiency and water management.
38%
7%
2% 1%
52%
50%
21%
29%
environment
41


