


 47 / 80

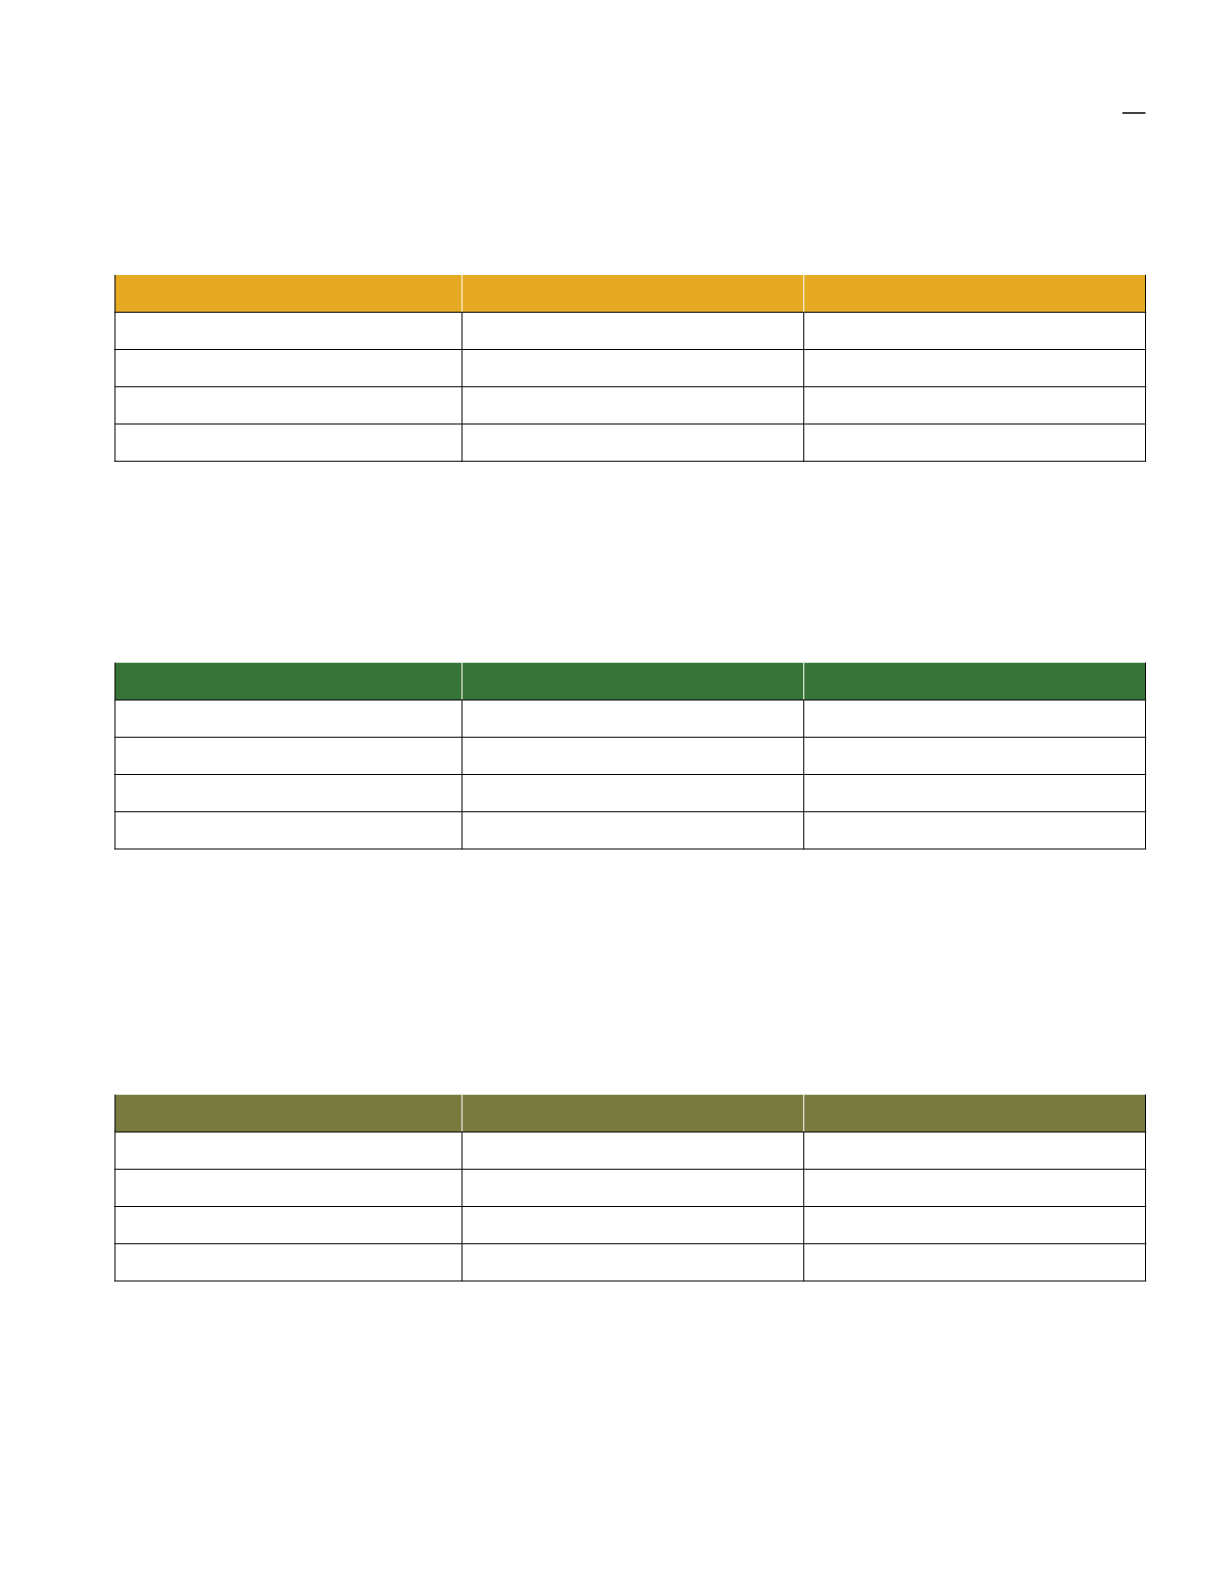
Head Office
Our greenhouse gas emissions
FYE2018*
FYE2019
Scope 1 – Direct emission
46.40 tCO
2
eq/litre*
47.64 tCO
2
eq/litre
Scope 2 – Indirect emission
1,386.25 tCO
2
eq/kWh*
1,318.08 tCO
2
eq/kWh
Total emissions
1,432.64 tCO
2
eq
1,365.72 tCO
2
eq
Emission intensity by square feet
0.0114 tCO
2
eq per square feet
0.0111 tCO
2
eq per square feet
* restated
Our Head Office’s direct emissions had increased slightly this year. On the other hand, indirect emissions had
dropped slightly due to the CO
2
offset from the installation of our building’s solar power panels; which meant we
relied slightly less on the grid.
Manufacturing
Our greenhouse gas emissions
FYE2018
FYE2019
Scope 1 – Direct emission
89.28 tCO
2
eq/litre
19.95 tCO
2
eq/litre
Scope 2 – Indirect emission
2,641.83 tCO
2
eq/kWh
2,403.43 tCO
2
eq/kWh
Total emissions
2,731.11 tCO
2
eq
2,423.38 tCO
2
eq
Emission intensity by Operating Hour 0.6184 tCO
2
eq per operating hour* 0.7225 tCO
2
eq per operating hour
* restated
Compared to FYE2018, our
Manufacturing Division
saw its petrol and diesel consumption reduce as a result of
lower production compared to the previous year. This has a direct effect on its scope 1 emission which had reduced
significantly. Similarly, electricity consumption had also reduced as a result of effective promotion of sustainable
practices such as switching lights off, sockets and electronic devices at all times when not in use. The result of this
is evident by the lower indirect emission of 9%.
Plantation
Our greenhouse gas emissions
FYE2018*
FYE2019
Scope 1 – Direct emission
54,064.47 tCO
2
eq/litre
51,921.84 tCO
2
eq/litre
Scope 2 – Indirect emission
146.28 tCO
2
eq/kWh
150.53 tCO
2
eq/kWh
Total emissions
54,210.75 tCO
2
eq
52,072.34 tCO
2
eq
Emission intensity by FFB Production 0.2178 tCO
2
eq per MT FFB production 0.2412 tCO
2
eq per MT FFB production
* restated
Figures from the last financial year include
Plantation Division’s
land development activities of new estates which
did not continue into this financial year. This is can be seen by the fall in direct emissions of 4% versus last year.
environment
45