
PLANTATION STATISTICS
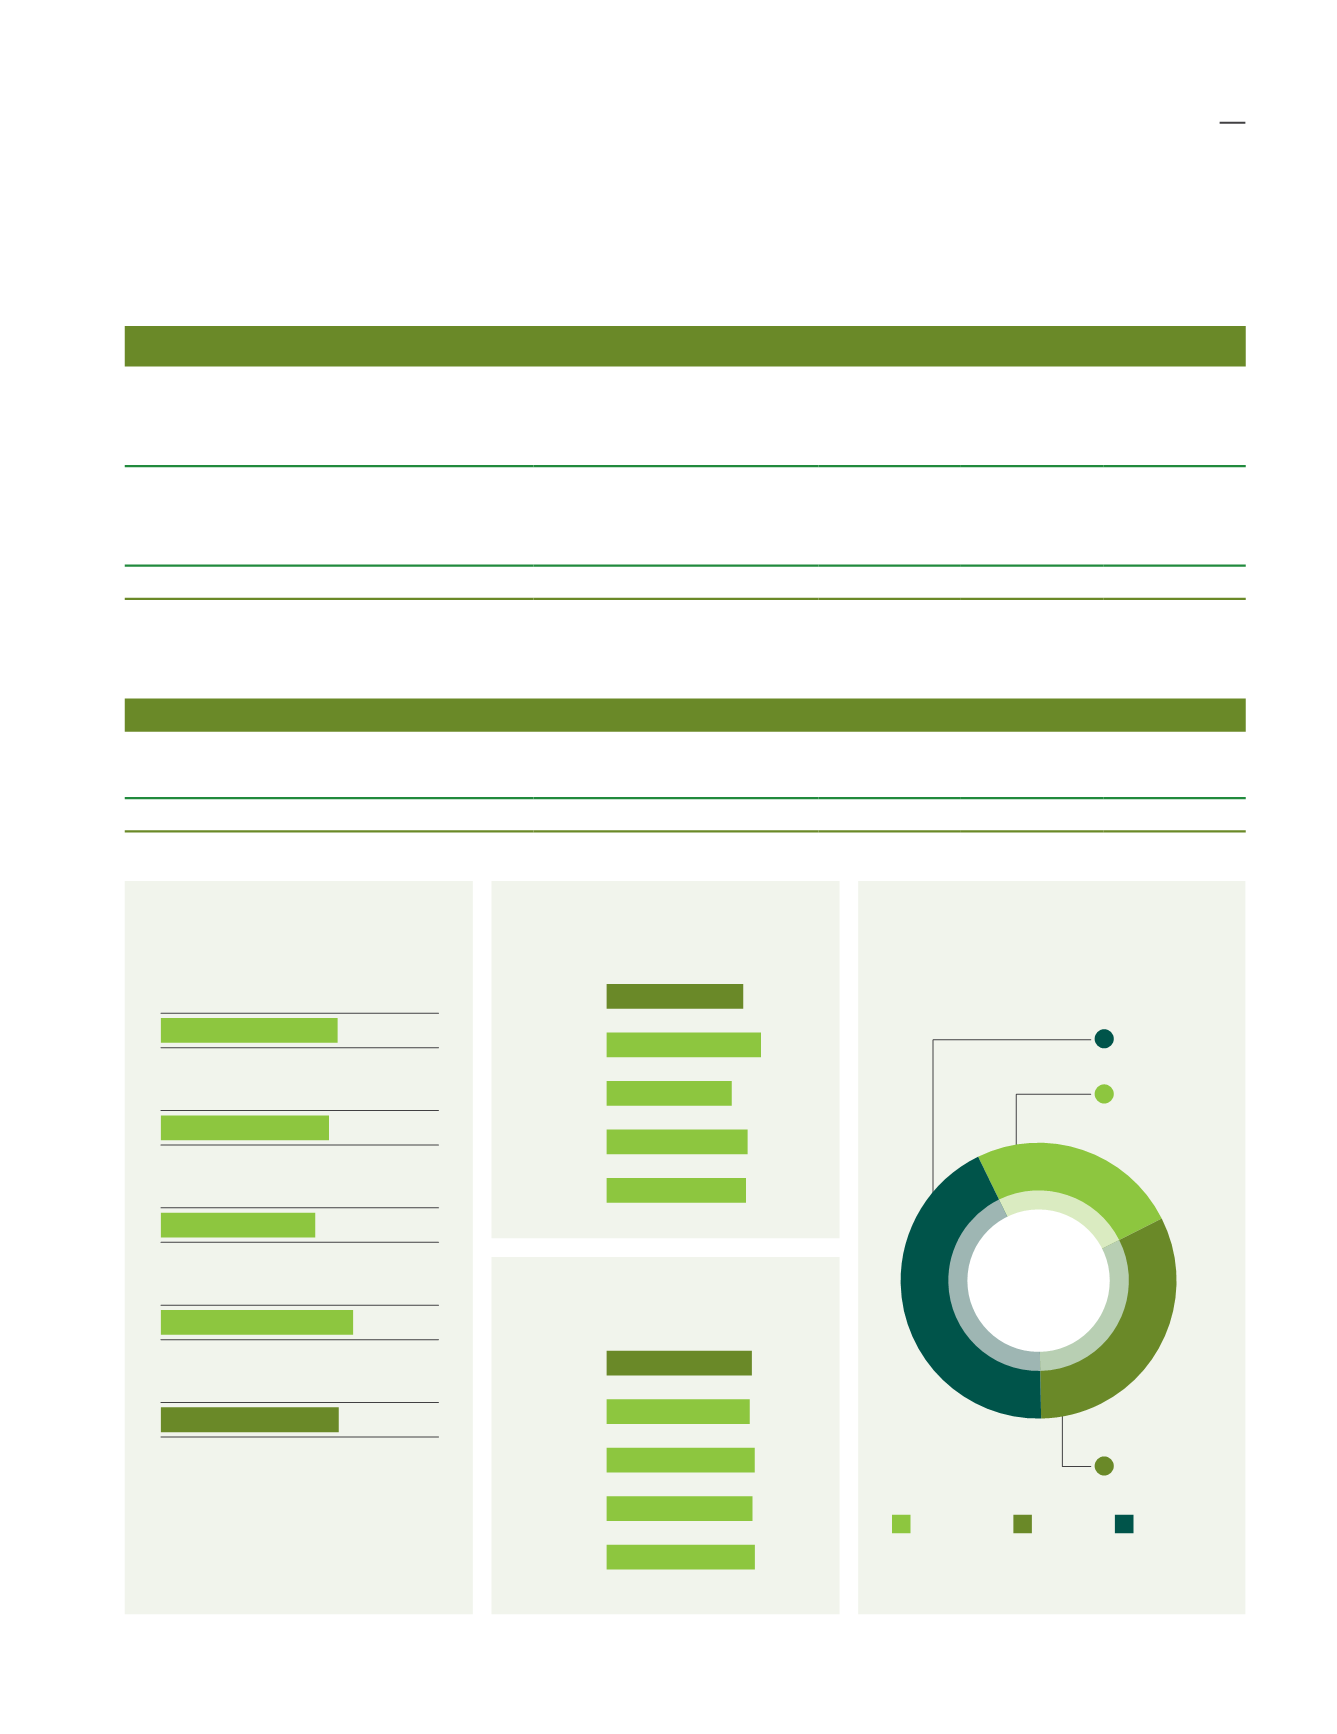
Palm Age Profile (HA)
FYE2015 FYE2016 FYE2017 FYE2018 FYE2019
> 19 years
432
-
-
-
124
10 - 18
6,154
6,154
6,214
6,206
6,647
4 - 9
1,097
1,594
1,502
1,913
2,808
7,683
7,748
7,716
8,119
9,579
Rehab
-
-
-
566
-
Immature
4,678
4,798
5,491
*5,271
4,660
Total Planted Area
12,361
12,546
13,207
13,956
14,239
*Note: Immature hectarage has been restated from last year (FYE2018: 5.447 ha).
Total FFB (MT)
FYE2015 FYE2016 FYE2017 FYE2018 FYE2019
FFB Production
162,526
164,738
149,753
198,644
198,910
FFB Purchased
60,677
53,198
51,853
60,460
49,902
Total FFB
223,203
217,936 201,606 259,104 248,812
CPO Production
(MT)
Yield Per Hectare
(MT)
Oil Extraction Rate
(%)
Total Oil Palm
Planted Area
(HA)
22.5%
3,208
44.4%
6,317
33.1%
4,714
22.90
20.77
19.40
21.30
21.10
Indonesia
Sarawak
Peninsular
Malaysia
47,966
FYE2019
51,887
FYE2018
41,619
FYE2017
45,387
FYE2016
47,649
FYE2015
FYE2019
FYE2018
FYE2017
FYE2016
FYE2015
FYE2019
FYE2018
FYE2017
FYE2016
FYE2015
22.34
22.09
22.70
22.42
22.71
performance
review
49


