


 71 / 244

Head Office
Our greenhouse gas
emissions
FYE2019
FYE2020
Scope 1 – Direct
emission
0 tCO
2
eq*
0 tCO
2
eq
Scope 2 – Indirect
emission
1,022 tCO
2
eq*
871 tCO
2
eq
Total emissions
1,022 tCO
2
eq*
871 tCO
2
eq
* Figures for FYE2019 has been restated
The shift to solar power has lessened the impact of our Head
Office’s indirect (scope 2) emissions.
Manufacturing
Our greenhouse gas
emissions
FYE2019
FYE2020
Scope 1 – Direct
emission
20 tCO
2
eq*
16 tCO
2
eq
Scope 2 – Indirect
emission
1,816 tCO
2
eq* 1,734 tCO
2
eq
Total emissions
1,836 tCO
2
eq*
1,750 tCO
2
eq
* Figures for FYE2019 has been restated
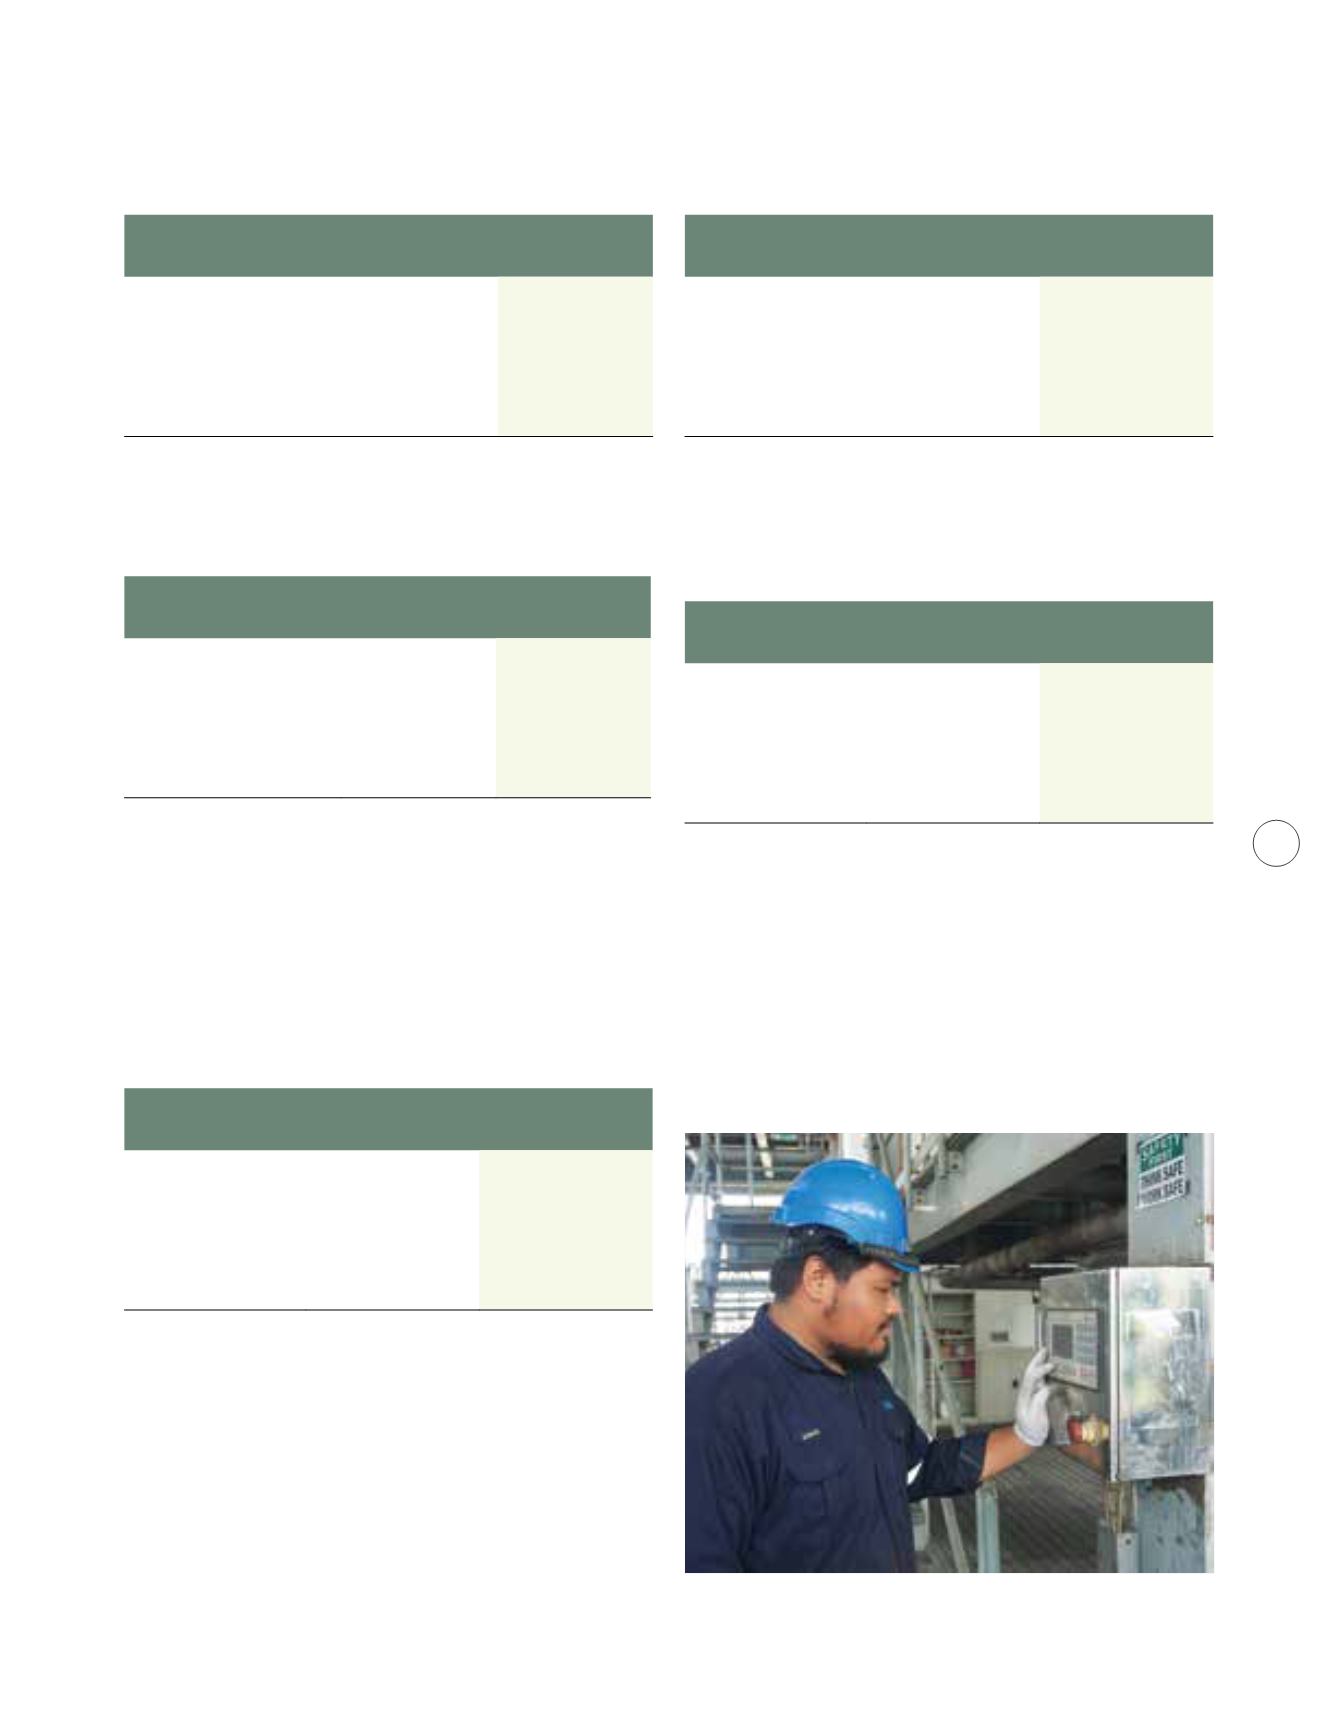
Manufacturing Division
’s petrol and diesel consumption
in FYE2020 was lower y-o-y as a result of lower production
volumes which in turn reduced its scope 1 emissions.
Similarly, electricity consumption had also reduced as a
result of effective promotion of sustainable practices such as
switching of lights, sockets and electronic devices at times
when not in use thereby resulting in lower indirect (scope 2)
emissions by 4.5%.
Plantation
Our greenhouse
gas emissions
FYE2019
FYE2020
Scope 1 – Direct
emission
51,230 tCO
2
eq*
48,975 tCO
2
eq
Scope 2 – Indirect
emission
114 tCO
2
eq*
123 tCO
2
eq
Total emissions
51,344 tCO
2
eq*
49,098 tCO
2
eq
* Figures for FYE2019 has been restated
Plantation Division’s
total emissions have decreased
by 4.4% mainly due to PTNJL mill having lower levels of
operations. Other factors contributing to the decline in
emissions include the reduction in methane emissions and
fertilizer applications by 7.7% and 8.2% respectively.
Note: Methane emission and fertilizer application falls under scope 1
Bulking
Our greenhouse
gas emissions
FYE2019
FYE2020
Scope 1 – Direct
emission
5,625 tCO
2
eq*
5,264 tCO
2
eq
Scope 2 – Indirect
emission
1,106 tCO
2
eq*
1,247 tCO
2
eq
Total emissions
6,731 tCO
2
eq*
6,511 tCO
2
eq
* Figures for FYE2019 has been restated
Bulking Division
recorded a 3.3% reduction in total
emissions y-o-y despite the ased operational activities and
higher throughput during the year.
Food
Our greenhouse
gas emissions
FYE2019
FYE2020
Scope 1 – Direct
emission
3,658 tCO
2
eq*
5,367 tCO
2
eq
Scope 2 – Indirect
emission
2,111 tCO
2
eq*
268 tCO
2
eq
Total emissions
5,769 tCO
2
eq*
5,635 tCO
2
eq
* Figures for FYE2019 has been restated
IFC recorded a slight y-o-y decline in its total emissions.
Its indirect (scope 2) emissions declined substantially from
2,111 tCO2eq last year to 268 tCO2eq; however this have
been offset by the increase in its direct (scope 1) emissions
due to a 31.8% increase in diesel usage for heat and power
generation.
Note: Scope 1 – CO2 emissions through a diesel engine, transportation,
chemical or physical operation
Scope 2 – Purchase of electricity from utilities companies
Sustainability : Environment
kumpulan Fima Berhad
(197201000167)(11817-V)
Annual Report 2020
67