


 68 / 232

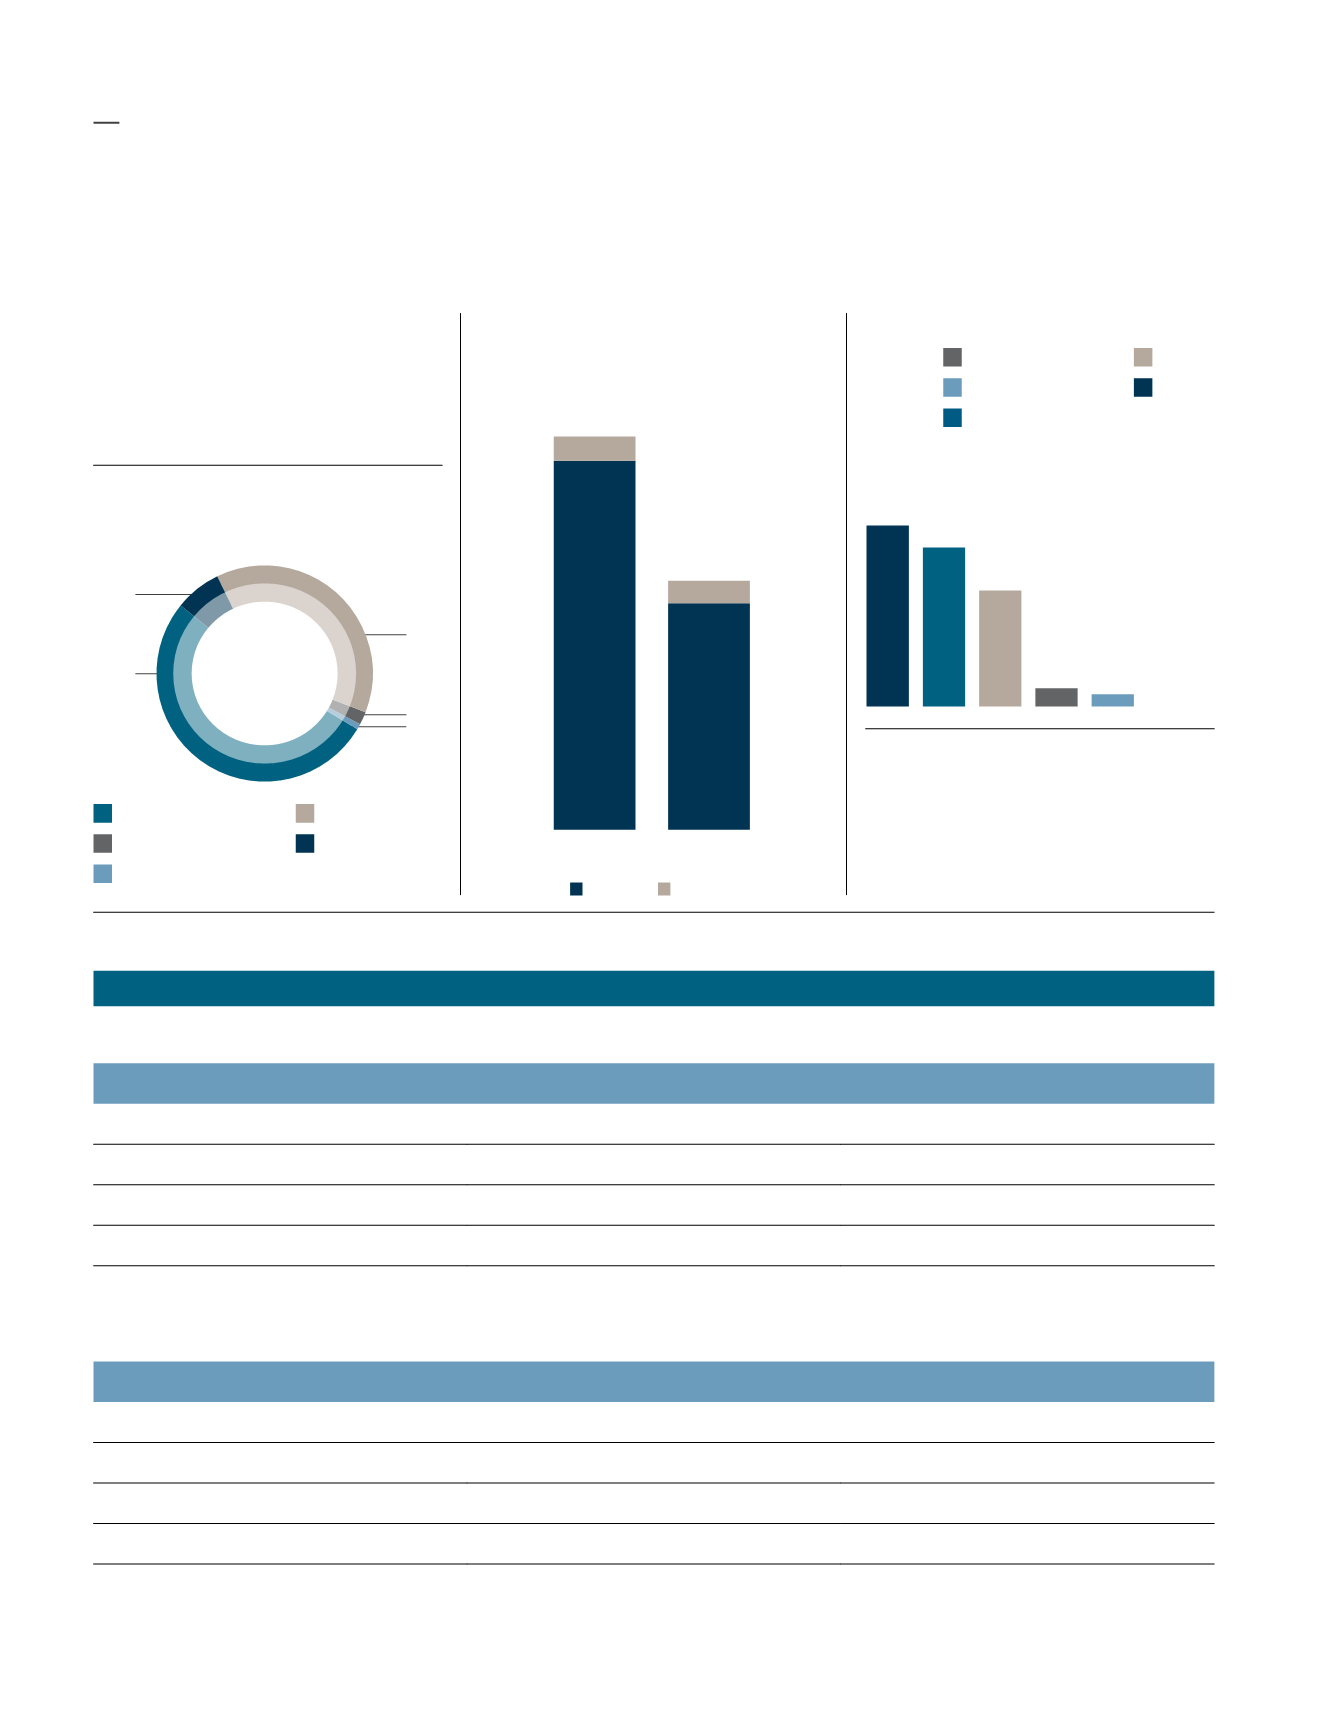
839,941.76
m
3
Total water consumed
by the Group
(FYE2018: 734,432 m
3
)
Plantation
Plantation
Food
Food
Manufacturing
Manufacturing
Head Office Building
Head Office Building
Bulking
Bulking
Breakdown Of Water
Consumption By Division (M
3
)
Total Group CO
2
eq
Total Energy Consumption (TJ)
1%
2%
38%
52%
7%
FYE2018
FYE2019
8,141.03
62,397.96
63,297.16
8,003.19
Scope 2
Scope 1
98.33
85.79
63.86
10.12
6.34
264.44
Terajoule
Total energy consumed
by the Group
(FYE2018: 142.73 Terajoule)
Head Office
Our greenhouse gas emissions
FYE2018*
FYE2019
Scope 1 – Direct emission
46.40 tCO
2
eq/litre*
47.64 tCO
2
eq/litre
Scope 2 – Indirect emission
1,386.25 tCO
2
eq/kWh*
1,318.08 tCO
2
eq/kWh
Total emissions
1,432.64 tCO
2
eq
1,365.72 tCO
2
eq
Emission intensity by square feet
0.0114 tCO
2
eq per square feet
0.0111 tCO
2
eq per square feet
*restated
Manufacturing
Our greenhouse gas emissions
FYE2018
FYE2019
Scope 1 – Direct emission
89.28 tCO
2
eq/litre
19.95 tCO
2
eq/litre
Scope 2 – Indirect emission
2,641.83 tCO
2
eq/kWh
2,403.43 tCO
2
eq/kWh
Total emissions
2,731.11 tCO
2
eq
2,423.38 tCO
2
eq
Emission intensity by operating hour 0.6184 tCO
2
eq per operating hour*
0.7225 tCO
2
eq per operating hour
*restated
Total Emission Breakdown by Division
sustainability performance
metrics
Kumpulan Fima Berhad
(11817-V)
Annual Report 2019
64