


 67 / 232

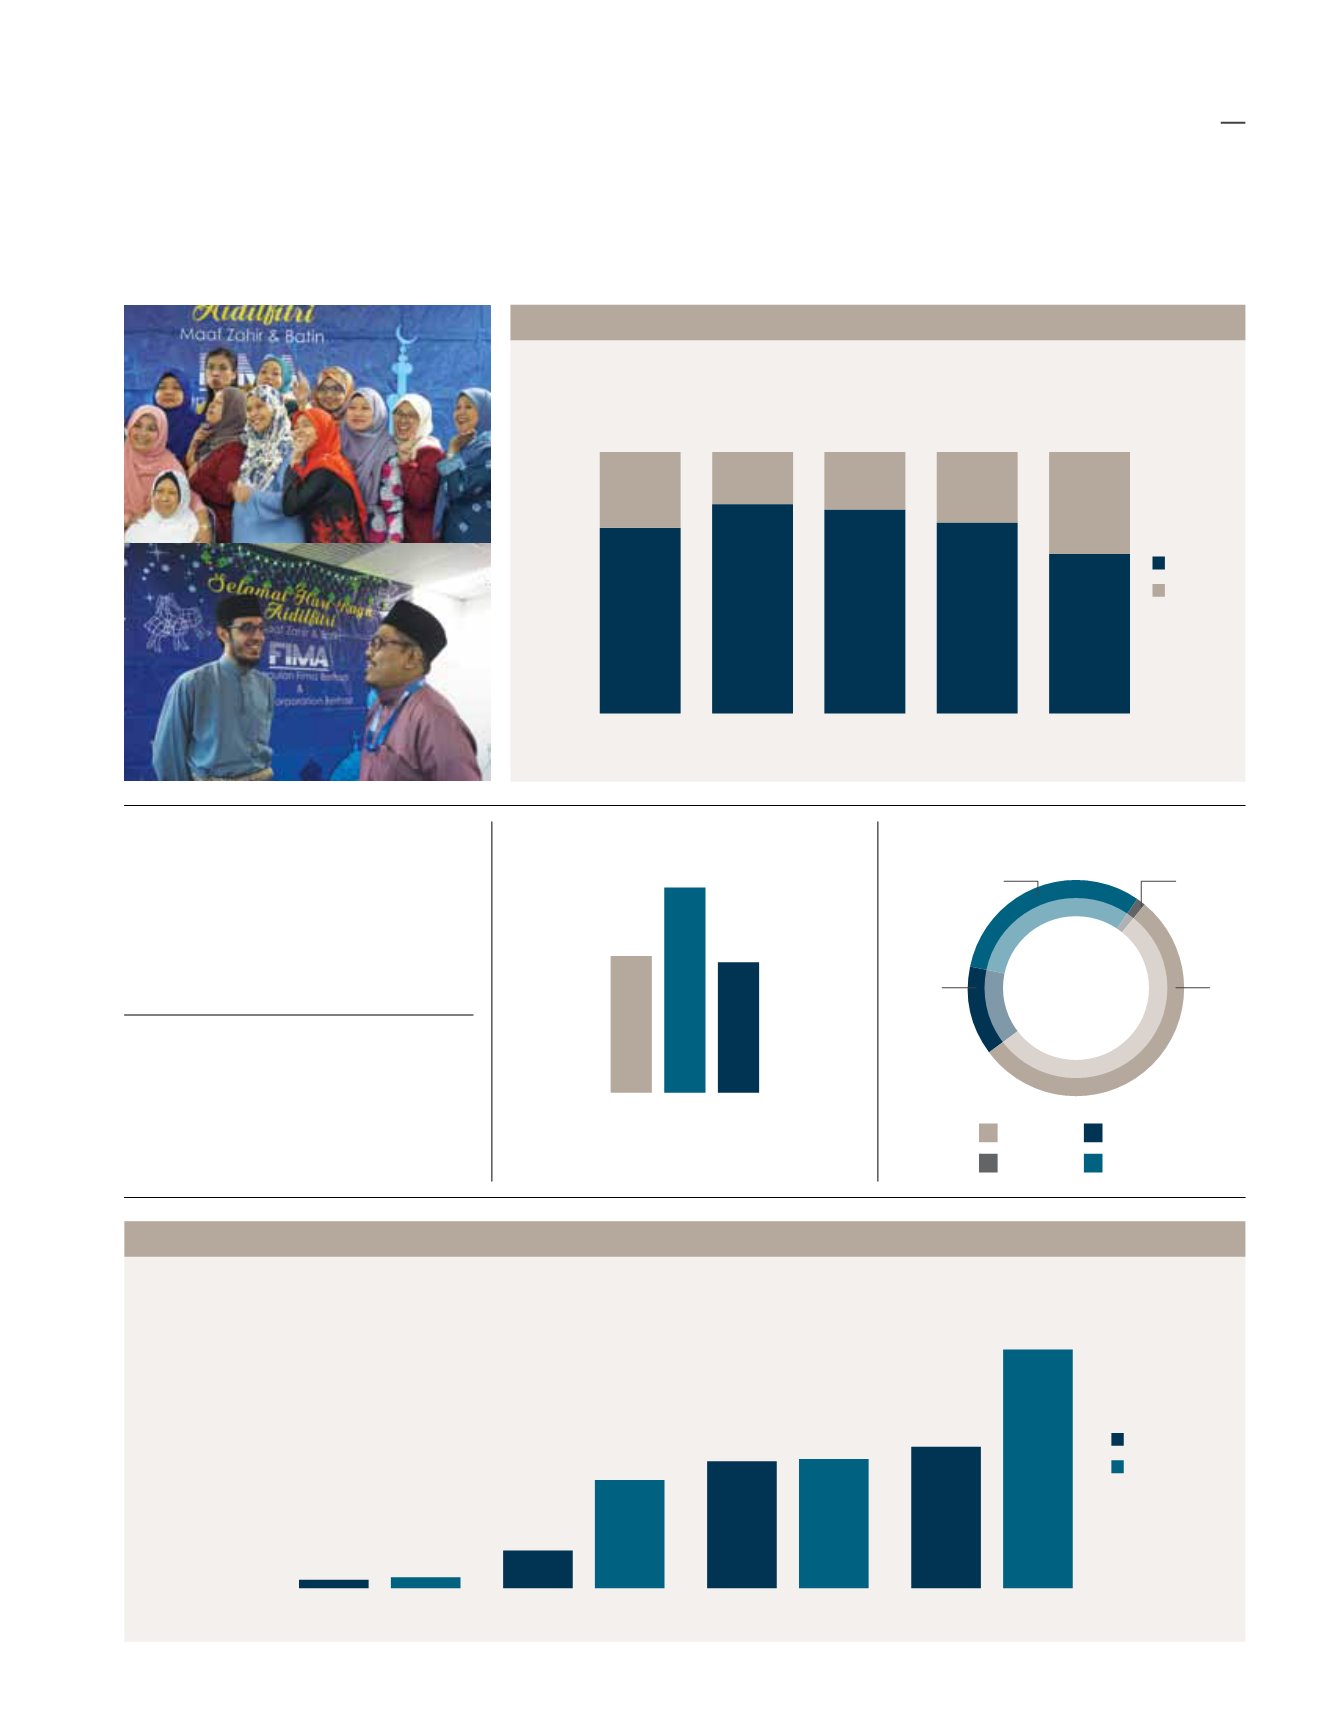
sustainability performance
metrics
BOD
Management Executive
Non-
Executive
Senior
Management
Senior Management
Management
Executive
Non-Executive
29%
71%
80%
20%
22%
78%
27%
73%
39%
61%
Male
Female
Lost Time Incident
Frequency Rate (LTIFR)
The Group recorded an LTIFR of
13.25
site for every 1 million
man-hours worked
(FYE2018: 8.21)
Total
Training Hours
The Group recorded
13,067
of training hours
(FYE2018: 8,454 hours)
Total No. of Recorded Injuries
1 Day 2-4
Days
>4
Days
22
38
29
Days of Medical Leave
Taken As Result of Injury
Tools
Physical
Falling objects
Chemical
Total Injuries By Type
48
12
28
1
FYE2018
FYE2019
224
290
3,424
3,460
1,013
2,917
3,793
6,400
Total Workforce Breakdown by Gender & Position FYE2019
Training Hours Breakdown by Position
sustainability
STATEMENT
63