


 22 / 220

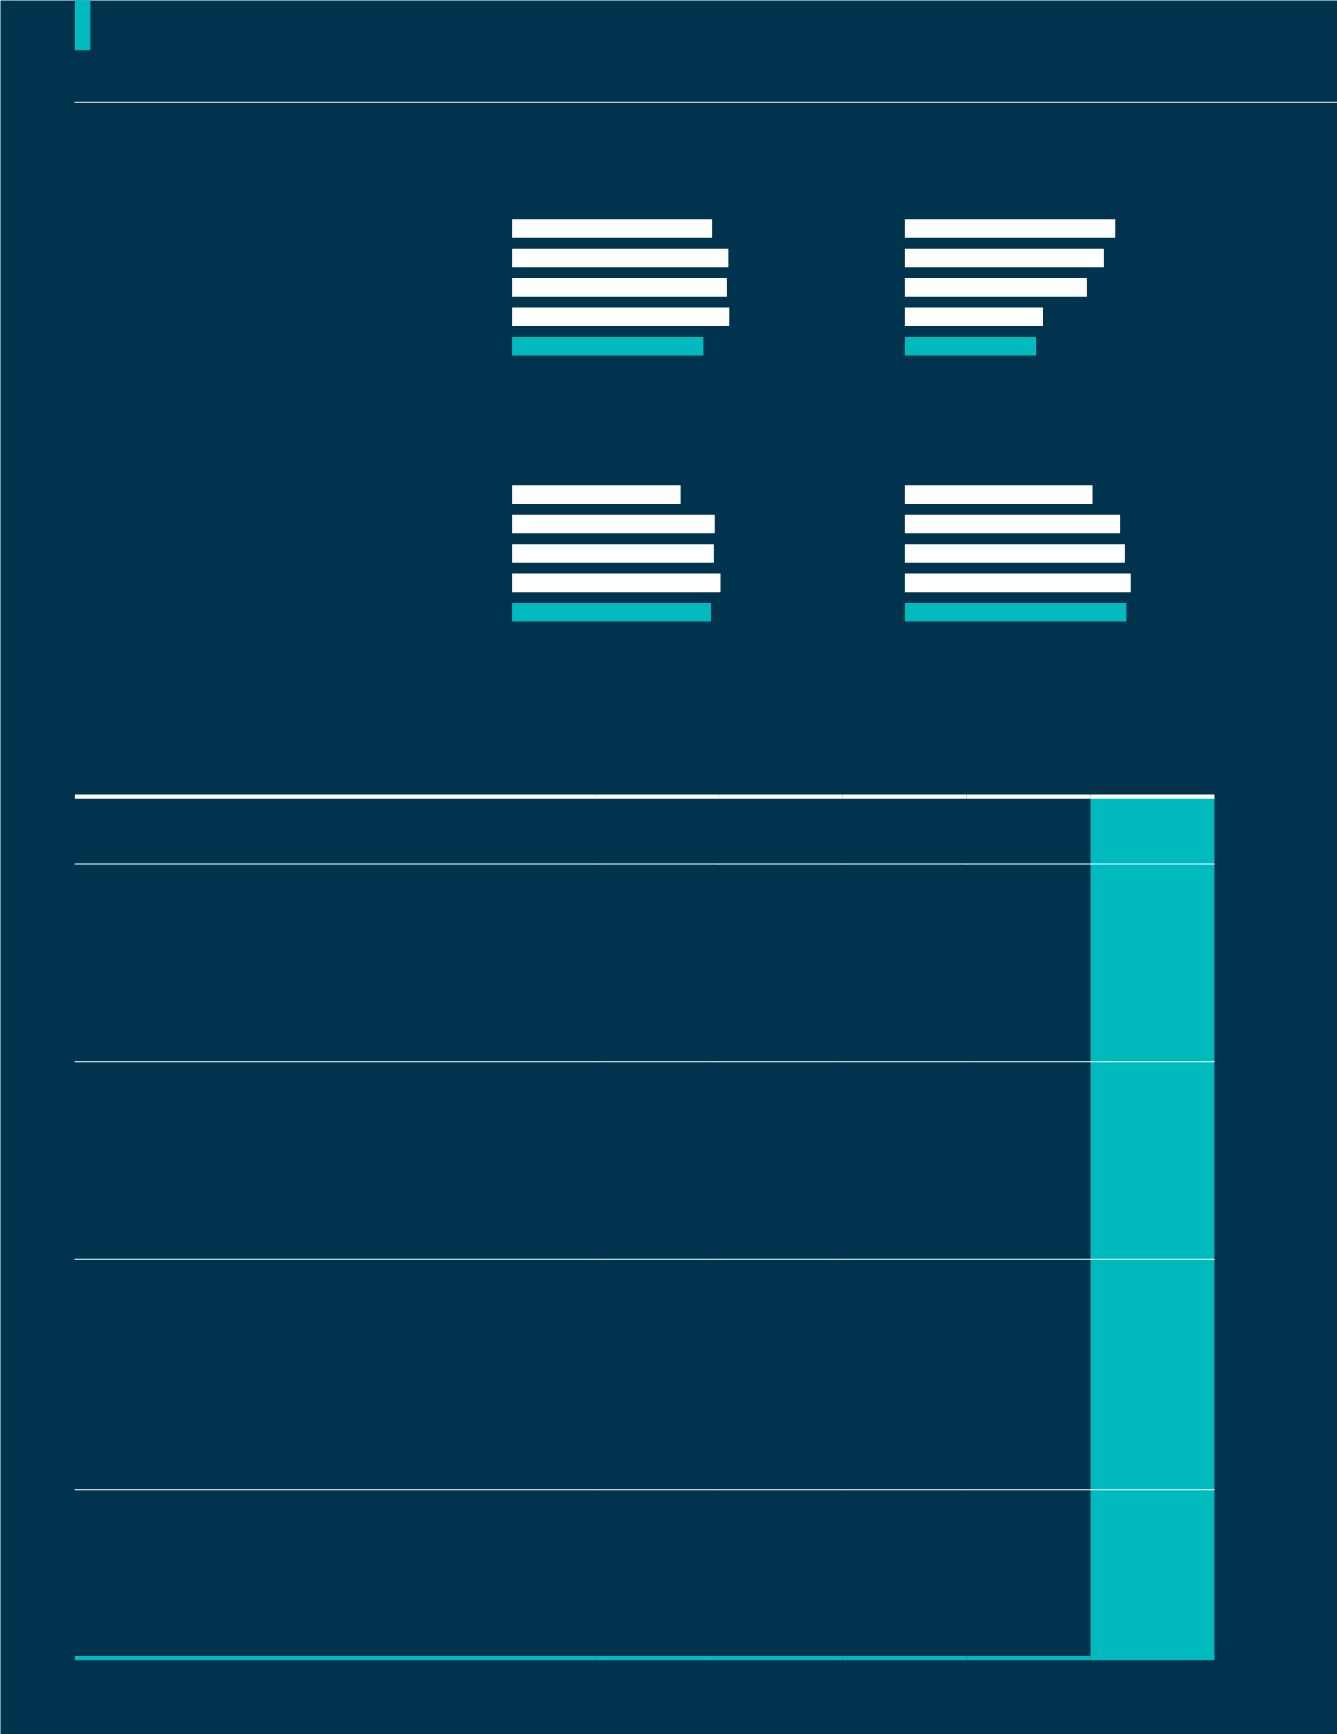
shareholders’ funds
(rm ’million)
Revenue
(rm ’million)
total assets
(rm ’million)
Profit Before Taxation
(rm ’million)
Year Group
Financial
Highlights
5
Financial Year Ended 31 March
(RM ’Million)
2014
2015
2016
2017
2018
REVENUE
504.59
544.79
541.11
547.21
482.46
PROFIT
Profit before taxation
129.36
122.30
111.67
84.67
80.48
Income tax expenses
39.33
38.29
31.67
34.24
31.72
Non-controlling interests
29.73
25.44
23.27
20.59
16.71
Profit after taxation and non-controlling interest
60.30
58.58
56.73
29.84
32.06
ASSETS AND LIABILITIES
Total assets
991.78 1,189.50 1,185.66 1,224.28
1,168.21
Total liabilities
128.55
211.49
186.38
197.87
170.61
Non-controlling interests
224.94
245.72
250.99
257.70
244.42
Shareholders’ funds
638.28
732.29
748.30
768.70
753.18
EARNINGS AND DIVIDEND
Earnings per share (sen)
Basic
22.16
21.26
20.51
10.70
11.36
Diluted
22.03
21.10
20.31
10.70
11.36
Gross dividend per share (sen)
8.00
8.50
9.00
9.00
9.00
Net dividend per share (sen)
8.00
8.50
9.00
9.00
9.00
SHARE PRICES
Transacted price per share (RM)
Highest
2.38
2.43
2.04
1.98
1.96
Lowest
1.87
1.75
1.72
1.70
1.45
482.46
2018
80.48
2018
547.21
2017
84.67
2017
541.11
2016
111.67
2016
544.79
2015
122.30
2015
504.59
2014
129.36
2014
1,168.21
2018
753.18
2018
1,224.28
2017
768.70
2017
1,185.66
2016
748.30
2016
1,189.50
2015
732.29
2015
991.78
2014
638.28
2014
1 8
Performance Review